Evaluating and Advancing Equity in Energy Transitions
By Sage Kime, Veronica Jacome, David Pellow, and Ranjit Deshmukh
Energy transition policies, if not carefully implemented, can create or exacerbate inequities, particularly affecting Black, Indigenous, and People of Color (BIPOC), low-income, and other frontline communities. While there is broad recognition that equity and justice are critical to the transition, a lack of metrics for evaluating outcomes hampers effective policymaking. To address this, we've constructed an analytical framework to evaluate justice and equity impacts of energy transitions.
Evaluating equity within energy transitions is complex and depends on the type of transition, population characteristics, and historical injustices within a given region. To develop this framework, we reviewed more than 400 articles and reports published between 2000 and 2023. We identified metrics used to quantify energy inequities in approximately 132 papers. We categorized the metrics into three equity dimensions: health, access, and livelihood. Each of these equity dimensions includes a specific set of indicators for equity evaluation, and each indicator contains multiple metrics to quantify, monitor, and evaluate that indicator.
How to use this information
This framework is designed to support policymakers, planners and other stakeholders in identifying important equity considerations and quantitatively evaluating the effects of decarbonization initiatives. Metrics can be adapted and combined with relevant socioeconomic and demographic data to evaluate impacts across communities, providing flexibility for tailored use in different contexts.
Energy equity evaluation framework
Click to explore the equity dimensions, indicators, and metrics.
Energy Equity Evaluation Framework. Click any wedge for its definition. Adapted from Kime, Jacome, Pellow & Deshmukh (2023), The 2035 Initiative.
Equity Dimensions
Health
Physical and emotional health externalities (positive or negative) associated with energy systems and transitions.
Access
Ability of individuals to equitably use, benefit from, and have control of energy transition resources (programs, technologies, services).
Livelihood
Opportunities for individuals to achieve social and economic well-being in relation to energy transitions.
Why equity metrics matter
The low-carbon energy transition offers an unprecedented opportunity to simultaneously address the climate and inequality concerns stemming from existing energy systems. To avoid perpetuating historical and creating new injustices, an equitable and just energy transition will require careful planning and execution. Measuring and evaluating the effects of existing and proposed programs and policies aimed at decarbonizing energy systems is critical. However, methods and metrics for evaluating equity effects vary across disciplines and transitions, making it challenging to identify effective evaluation strategies.
Using equity metrics to evaluate four energy transitions
Our review focuses on four main energy transitions—renewable energy deployment, transportation electrification, fossil fuel infrastructure phaseout, and residential building decarbonization. We selected these transitions because they will play a significant role in achieving economy-wide decarbonization and because they will directly affect communities and households in the process. These sectors have created and maintained energy injustices through their extraction, generation, distribution, and consumption, both in the US and around the world. At the same time, energy transitions within these sectors provide a unique opportunity to address both historical and future injustices while mitigating GHG emissions. In 2020, the power, transportation, and building sectors were responsible for the majority of global CO2 emissions from energy, accounting for 44%, 23%, and 8% of the total, respectively (IEA 2021a).
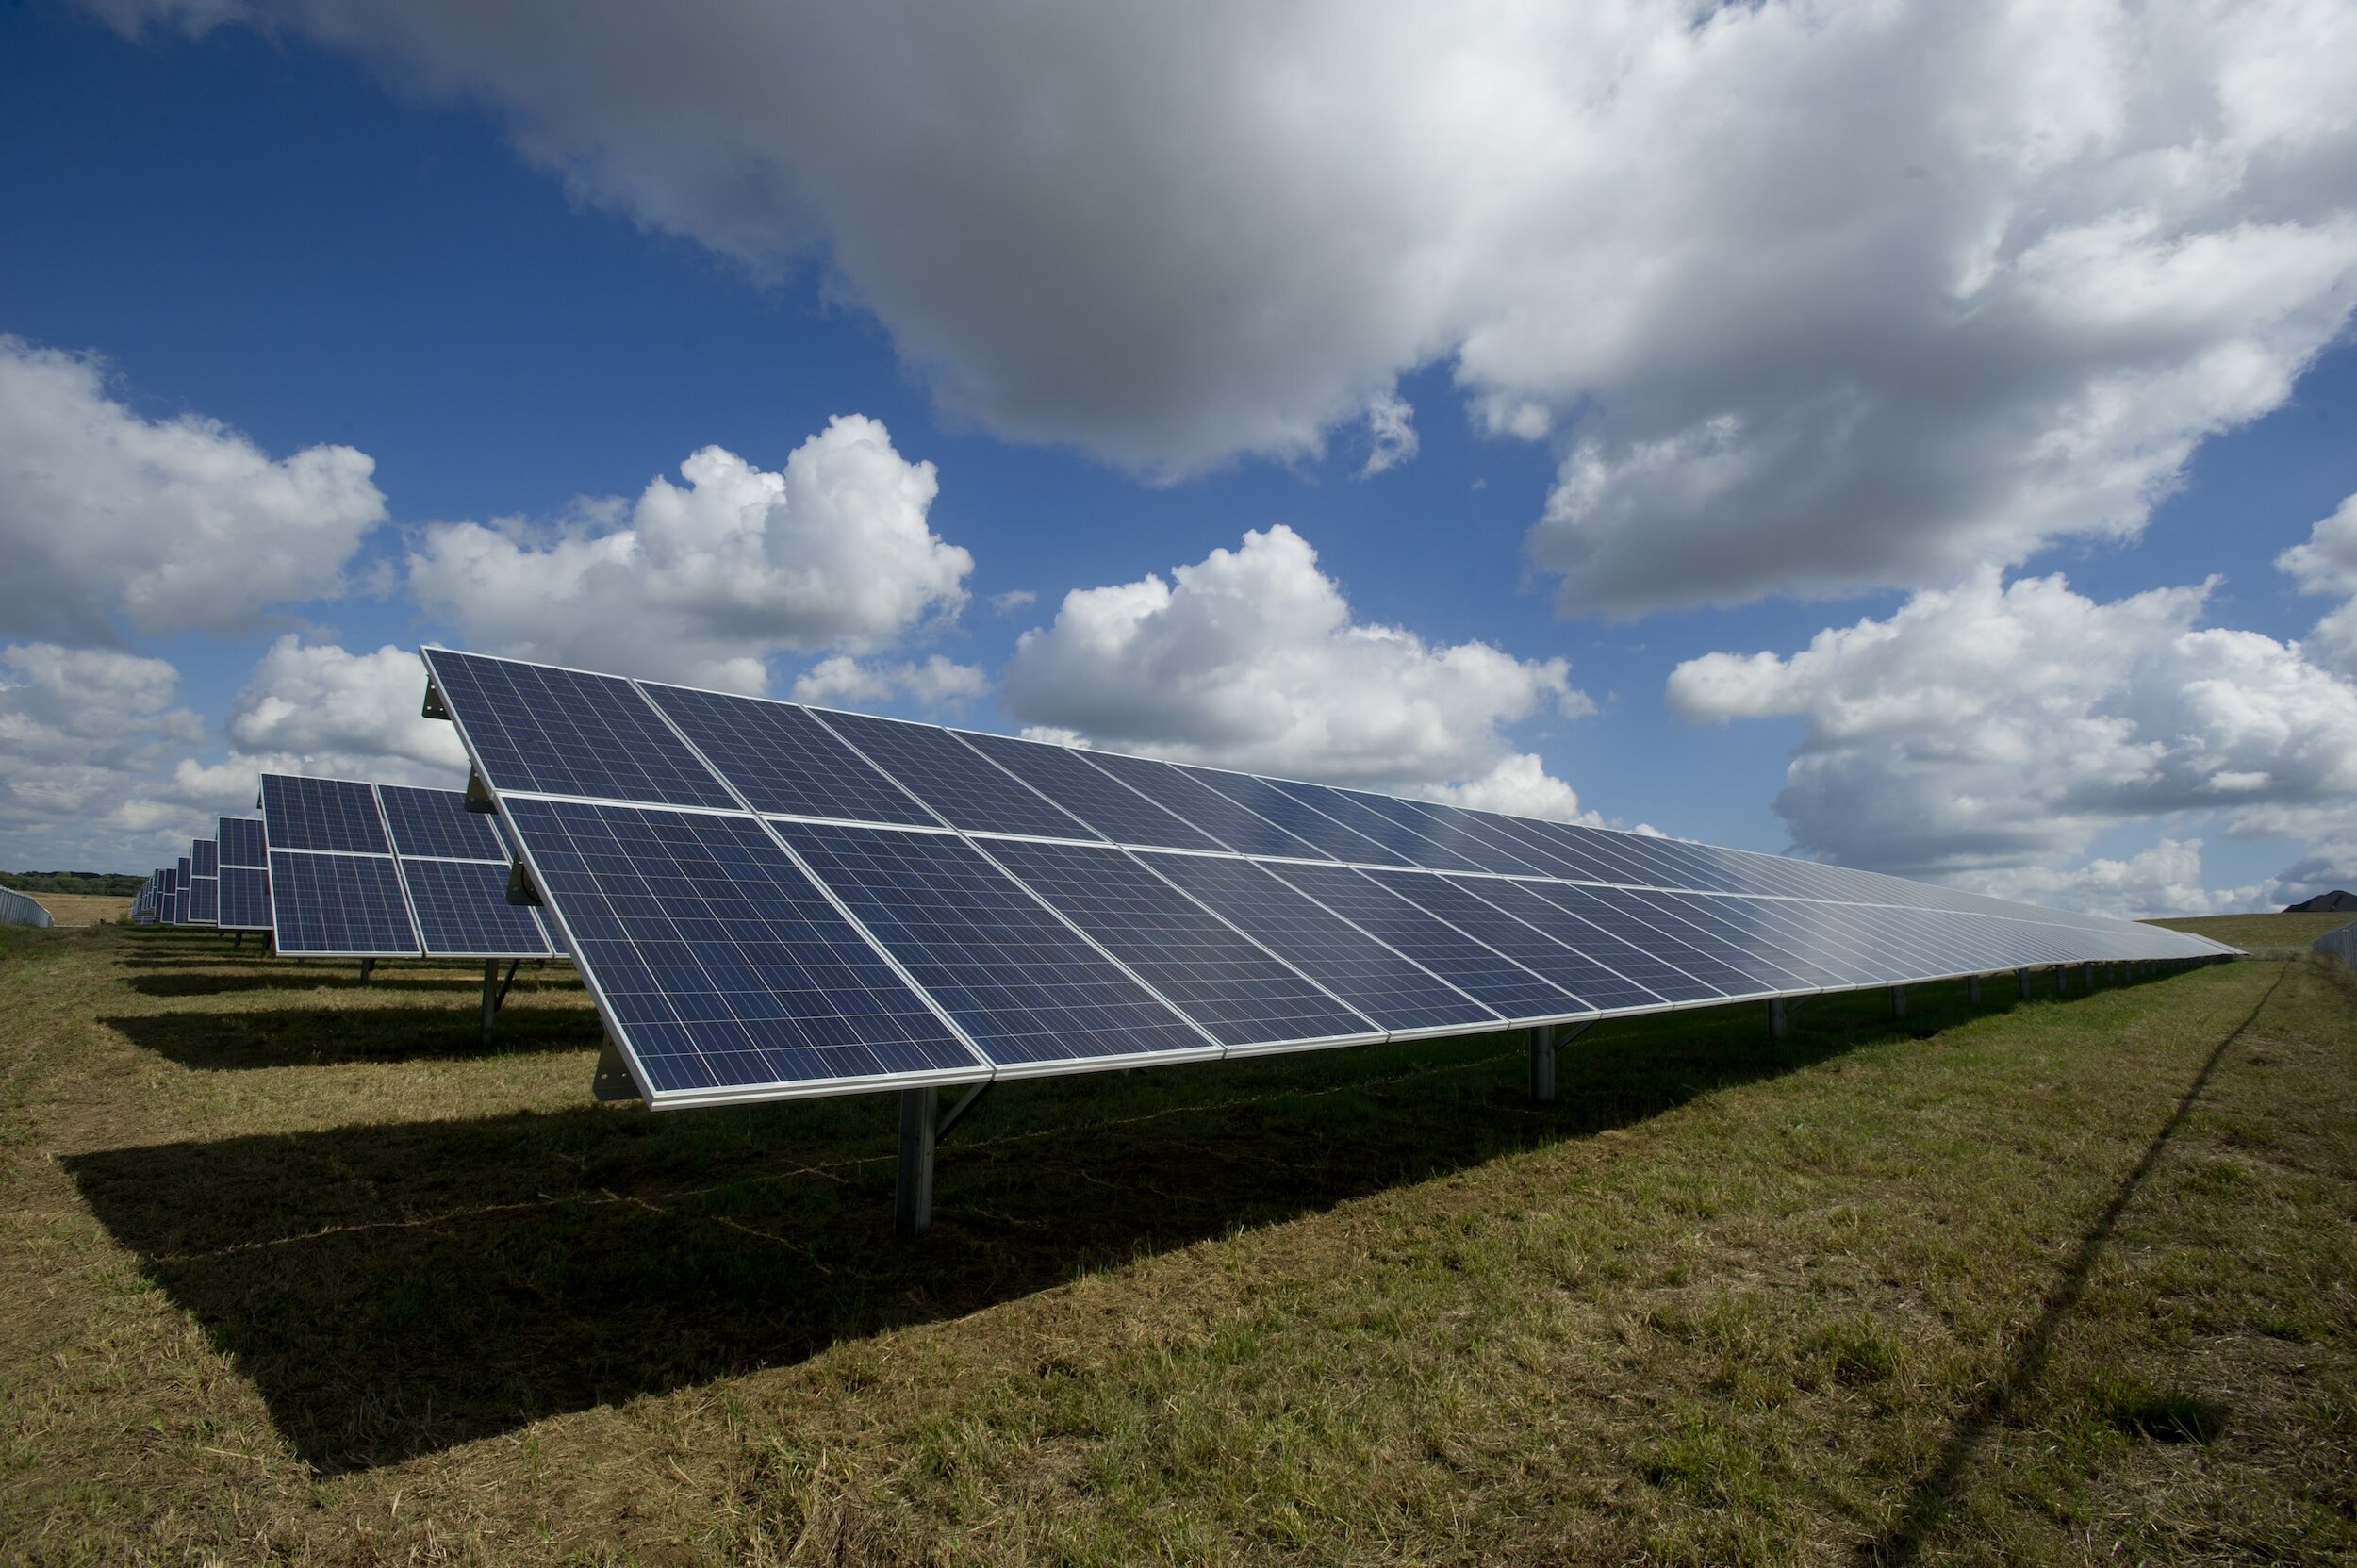
Increased deployment of renewable energy will have benefits in the form of avoided health impacts and related costs, but this transition also has a documented history of inequities across the three equity dimensions. For example, mineral extraction for solar and wind energy can pose health risks for workers. Renewable energy technology has also not been distributed evenly, with disparities by race and ethnicity persisting even when controlling for income or homeownership. Large hydropower projects have contributed to mass displacement and disruption of local populations' way of life, especially Indigenous communities.
Renewable energy deployment through the equity framework
Click to explore this transition's equity dimensions, indicators, and metrics.
Metric
Measurement
Example
Proximity to renewable energy infrastructure
Cumulative population living near RE infrastructure (#), proportion of population living near RE infrastructure (%)
Under a high-electrification net-zero-by-2050 scenario, ~12–15% of the western US population (9.5–12.5 million people) could live within 16 km of a wind plant or 3 km of a solar plant (Wu et al. 2023).
Metric
Measurement
Example
Occupational pollutant concentration and exposure
Air concentration of pollutants (mg/m³), maximum worker exposure concentration (kg/m³)
Air samples at a solar PV component plant found indium (a toxic metal) at 0.072–5.4 mg/m³, compared with an occupational limit of 0.1 mg/m³ (Hines et al. 2013).
64.6–94.1% of soil samples near Chinese mining sites exceeded national cadmium standards (Zhou et al. 2018); lead concentrations near another mining valley were 56x the global average (Li et al. 2019).
US renewable deployment (2007–2015) avoided an estimated 3,000–12,700 premature deaths from reduced SOx, NOx, and PM2.5 (Millstein et al. 2017).
Sleep disturbance and psychological effects
Proportion of respondents reporting sleep disturbance (%), sleep quality index, mental health score
48% of respondents reported sleep disturbance where wind-turbine noise exceeded 45 dB(A) (Bakker et al. 2012); Maine residents living closest to turbines reported worse sleep quality and mental health scores (Nissenbaum et al. 2012).
Metric
Measurement
Example
Monetized health benefits or costs
Cumulative health benefits ($), annual health benefits ($ per year), health benefits per ton of CO2 reduced ($/tCO2), health benefits per unit of energy produced ($/MWh)
US renewable deployment (2007–2015): $29.7–112.8B in health benefits (Millstein et al. 2017). 2013 state renewable targets: $5.2B in benefits (Barbose et al. 2016). Rust Belt RE targets: $94/ton CO2 in 2030 (Dimanchev et al. 2019). PJM region: $14–170/MWh depending on project type and location (Buonocore et al. 2016).
Metric
Measurement
Example
Solar PV installation limitations
Proportion of solar PV systems installed by building type (%), proportion installed by homeownership status (%)
Only ~3% of US solar systems are installed on multifamily buildings (Forrester et al. 2022); 97% of single-family solar sits on owner-occupied units, 3% on renter-occupied (EIA 2022). In Australia, 6% of rentals had solar PV vs. 30% of owner-occupied homes (2022).
Metric
Measurement
Example
Solar PV cost
Total solar PV system cost ($), willingness to pay for solar PV system ($), LCOE from solar PV by country ($)
Irish homeowners were willing to pay €6,200 for a system that actually cost €20,000–25,000 (Claudy et al. 2011). Levelized solar costs in Liberia, Sudan, and Sierra Leone run 2.5x higher than in Botswana, Namibia, South Africa, and Morocco (Mulugetta et al. 2022).
Metric
Measurement
Example
Solar PV adoption
Median income of solar adopters compared to US household median income ($), share of solar adopters classified as low-to-moderate income (%), relative solar PV adoption across census tracts by race/ethnicity (%), relative adoption shares by disadvantage scores
2020 US solar adopters had a median income of $115K vs. $63K nationally (Forrester et al. 2022). Black-majority census tracts installed 69% fewer rooftop PV, Hispanic-majority tracts 30% fewer, than no-majority tracts at equal income (Sunter et al. 2019). California's most disadvantaged tracts have 8x lower deployment (Lukanov & Krieger 2019).
Solar PV penetration (adoption as a share of potential)
Low-to-moderate income (LMI) solar PV penetration rate (# LMI solar systems per 1000 owner-occupied LMI households per quarter), change in rooftop PV penetration by English proficiency, LMI market share, and other factors (%)
Low-income incentives increased LMI PV penetration by 0.7 adoptions/quarter, leasing by 1.5 (O'Shaughnessy et al. 2021). A 10-point rise in limited-English-proficiency households was linked to 36% lower rooftop penetration in San Bernardino (Reames 2020).
Metric
Measurement
Example
Renewable energy incentive allocation
Solar incentive distribution by income (%), share of solar incentives distributed from low-income incentive programs (%)
The bottom 50% of tax filers received only 10% of all renewable-energy tax credits, 2006–2012 (Borenstein & Davis 2016); roughly 1% of all incentives come from low-income-specific programs (Paulos 2017; O'Shaughnessy et al. 2021).
Solar PV leasing program participation
Proportion of solar adopters leasing PV systems (%)
49% of solar adopters in low-income communities used leasing programs, vs. 42% elsewhere (O'Shaughnessy et al. 2021).
Metric
Measurement
Example
Representation in energy/utility leadership
Proportion of executives by race, sector, and gender (%)
88% of solar-industry senior executives were White and 80% were men (2019); women hold ~13.9% of senior management across energy and utilities overall, 10.8% within renewables specifically (IEA 2021).
Metric
Measurement
Example
Number of jobs
Jobs per unit of energy (job-years/GWh), cumulative direct jobs (#), annual direct jobs (# per year)
Solar PV creates ~0.87 job-years/GWh vs. 0.11 for natural gas (Wei et al. 2010). A well-below-2°C pathway could grow direct energy jobs from 18M to 26M by 2050 (Pai et al. 2021); a net-zero transition could support ~3M annual direct jobs in the first decade (Mayfield et al. 2021).
Compensation
Relative median hourly wage ($/hr)
Wind and solar workers earn a median $25.95/$24.48 per hour vs. $30.33/$28.69 for natural gas/coal workers (NASEO, EFI & BW Research 2021).
Workforce changes
Change in workforce availability (%), employee turnover rate (%)
Construction of Brazil's Belo Monte dam was linked to a 50% decrease in nearby rural farm labor; 76% of construction hires lasted 3 months or less (Calvi et al. 2020).
Workforce representation
Proportion of female workers in workforce (%), proportion of Black workers in workforce (%)
Women make up ~30% of the US solar workforce and 31% of wind, vs. 47% of the national workforce; Black Americans are ~8% of the solar/wind workforce vs. 12% nationally (NASEO & EFI 2020).
Metric
Measurement
Example
Property value
Change in property value associated with proximity to energy development (%)
Wind projects within 2 km reduced property values 4–5% in the UK and 1.4–5.4% in the Netherlands (Dröes & Koster 2016/2021; Jarvis 2021); solar effects were mixed, up to a 2.6% reduction in some studies.
Energy asset ownership
Proportion of energy assets owned by women, BIPOC, or local residents (%)
Women make up only 22% of owners in Germany's citizen-owned renewable energy plants (Fraune 2015).
Metric
Measurement
Example
Energy expenditures
Average utility rate increase ($/kWh), average annual utility rate increase ($ per year)
States with renewable portfolio standards saw electricity prices rise 0.91¢/kWh (11.6%) more than non-RPS states (Upton & Snyder 2017); CA solar incentives were linked to a 3–5¢/kWh rate increase, or $124–230 more per household annually (Borenstein et al. 2021).
Metric
Measurement
Example
Displacement
Cumulative estimate of displaced population (#), estimate of affected population (#), share of affected population identified as Indigenous (%)
Large hydropower has displaced an estimated 40–80 million people worldwide (WCD 2000). Brazil's Belo Monte dam was projected to displace 20,000 of the 25,000 Indigenous people living nearby (VanCleef 2016). Indian hydropower displaced ~25M and affected 40M more without physical displacement, 40%+ from tribal groups (Fernandes 2004).
Natural resource security
Change in annual fish harvest (%), change in fish habitat area (%), cumulative estimate of affected population (#)
The Three Gorges Dam cut major carp harvests 50–70% (Xie et al. 2007); Elwha River dams reduced salmon habitat 90% (Pess et al. 2008); large hydropower may affect an estimated 472M people downstream globally (Richter et al. 2010).
Conflict and/or violence
Total reported mining-related conflicts (#), share of mining-related conflicts by mineral type (%)
167 mining-related conflicts were reported 2012–2013, 26% tied to minerals critical to renewable energy technologies (Andrews et al. 2016).
Transition 2 of 4
Transportation Electrification
The transportation sector is one of the largest contributors of GHG emissions across the world, making transportation electrification a crucial element of the low-carbon energy transition. While mass transport electrification will certainly have environmental and health benefits, early stages of the transition indicate potential equity effects that must be considered. Growing demand for lithium and cobalt poses health and safety risks to workers. Access to electric transportation resources is also distributed unequally across race, ethnicity, and income level. An unmanaged transition to electric transportation can also result in job losses in the traditional auto sector.
Transportation electrification through the equity framework
Click to explore this transition's equity dimensions, indicators, and metrics.
Metric
Measurement
Example
Proximity to major roadways
Total population living near roadways (#), proportion of population living near roadways by race/ethnicity (%)
3.7% of the US population (11.3M people) lives within 150m of a major highway: 5.0% of Hispanic residents, 4.4% of Black residents, and 3.1% of White residents (Boehmer et al. 2013).
Metric
Measurement
Example
Pollutant emissions
Pollutant emissions per vehicle (lbs/vehicle)
EV adoption paired with a coal-heavy grid could add up to 1.2 lbs/vehicle in annual PM2.5 emissions in the PJM region (Weis et al. 2015).
Residents near DRC cobalt mining have urinary cobalt levels 43x the US average, and blood cobalt 5.7x the control group (13.1x for mine workers) (Banza et al. 2009; Nkulu et al. 2018).
100% EV sales paired with a clean grid could avoid 111,000 deaths by 2050 (American Lung Association 2022); electrifying public buses and rail could avoid 4,200 deaths/year (Data for Progress 2021).
Metric
Measurement
Example
Monetized health benefits or costs
Cumulative health benefits ($), health benefits per mile ($/mile)
A 100% EV transition could yield $1.2T in health benefits by 2050 (American Lung Association 2022); electrified buses/rail ~$100B in avoided damages (Data for Progress 2021); light-duty EV transition benefits of 3.4–11.5¢/mile driven (Choma et al. 2020).
Metric
Measurement
Example
Public EV charger availability
Likelihood of public EV charger access (odds ratio), rate of EV chargers per 1,000 households
Black/Hispanic-majority block groups are 0.7x as likely to have public charger access, and even less likely for publicly funded chargers (Hsu & Fingerman 2021). CA's disadvantaged communities have 0.67 Level-2 / 0.61 DC fast chargers per 1,000 households vs. 0.92 / 0.13 in non-disadvantaged areas (Canepa et al. 2019).
Home EV charging availability
Proportion of households with parking availability near an electrical outlet (%)
~50% of US households can park within 25ft of an outlet at home (Axsen & Kurani 2012); 2020 RECS data put this at ~55% for households excluding large apartment buildings (EIA 2022).
Metric
Measurement
Example
Up-front technology costs
Cost difference between EV and internal combustion engine models ($)
EVs still cost $8,000–21,000 more than comparable conventional vehicles (Lutsey & Nicholas 2019).
EV charging costs
Relative cost difference between public and at-home EV charging
Public charging typically runs 2–3x more per kWh than charging at home (Bauer et al. 2021).
Metric
Measurement
Example
EV adoption
Relative EV adoption by income and zip code; income disparity between used EV and ICE vehicle purchasers ($); proportion of purchases by vehicle type and race/ethnicity (%); likelihood of EV ownership by homeownership status; proportion of households owning EVs (%)
Gasoline-vehicle adoption is ~2x higher in high- vs. low-income zip codes; EV adoption is 3–5.7x higher (Bauer et al. 2021). Used-EV buyers had a median income of $150K vs. $90K for used gas-vehicle buyers (Turrentine et al. 2018). Black and Hispanic buyers make up 41% of gas-vehicle purchases but only 12% of EV purchases (Muehlegger & Rapson 2018). Homeowners are 3x more likely than renters to own an EV (Davis 2019); under 0.5% of households in disadvantaged CA communities own an EV vs. 1.7% elsewhere (Canepa et al. 2019).
Metric
Measurement
Example
EV rebate allocation
EV subsidy allocation by income and disadvantage score (%), share of EV incentive dollars by income (%)
CA's bottom 75% of census tracts by income received just 38% of EV subsidies distributed 2010–2018, while the top 12.5% most-advantaged tracts got 25% (Guo & Kontou 2021); disadvantaged communities received 77% fewer rebates per 1,000 households (Ju et al. 2020). Nationally, taxpayers earning $75K+ received ~90% of federal EV incentive dollars, 2009–2012 (Borenstein & Davis 2016).
EV rebate awareness
Share of households aware of EV rebates (%)
Fewer than 40% of surveyed low- and moderate-income CA households were aware of state EV rebates (Pierce et al. 2020).
Metric
Measurement
Example
Number of jobs
Cumulative job losses (#), relative direct labor hours
A shift to 50% BEV sales by 2030 could cost ~75,000 US auto-sector jobs without policy support (Barrett & Bivens 2021). California's 100% EV mandate by 2035 is projected to cause 64,700 job losses, netting to 39,800 by 2040 after new job creation (Lopez 2022). EVs require ~30% fewer manufacturing hours per vehicle (Hackett 2017).
Workforce representation
Relative share of workers in vulnerable occupations by race and education level (%)
Black workers are 12.5% of the US workforce overall but 16.6% of the auto sector; workers without a bachelor's degree are 62.2% of the workforce overall but 74.6% of the auto sector (Barrett & Bivens 2021).
Metric
Measurement
Example
Conflict and/or violence (child labor)
Proportion of child labor by industry (%), share of mines with children present (%), cumulative child labor estimates (#)
23% of DRC households reporting child labor had children working in mining, and 29% of artisanal mines have children present; an estimated 40,000 children work in dangerous conditions in the Southern Katanga region (Faber et al. 2017; BGR 2019; UNCTAD 2020).
Transition 3 of 4
Fossil Fuel Phaseout
Phasing out fossil fuel infrastructure will have significant benefits such as reduced health impacts including cancer, respiratory illness, and adverse birth outcomes that disproportionately burden People of Color, Indigenous, and low-income communities nearby. However, the benefits from the phaseout may not be distributed equitably. Fossil fuel dependent communities have experienced, and will likely continue to experience, disproportionate social, cultural, and economic impacts resulting from the phaseout or decline of local industrial operations.
Fossil fuel phaseout through the equity framework
Click to explore this transition's equity dimensions, indicators, and metrics.
Metric
Measurement
Example
Proximity of fossil fuel infrastructure
Cumulative population living near FF infrastructure (#), proportion of population living near FF infrastructure (%) by race/ethnicity, likelihood of power plant siting by neighborhood grade (%)
17.6M people live within 1,600m of an active US oil/gas well (Czolowski et al. 2017); 6.1M within 3 miles of a refinery (EPA 2015). In California, 5.4M live within a mile of a well, with 1.8M in the most pollution-burdened communities (Srebotnjak & Rotkin-Ellman 2014). Black Oklahomans are 8% of the state's population but 28% of those living within 1.5km of a fracking well (Zwickl 2019). Historically redlined ("D-grade") neighborhoods had 72% higher odds of a power plant sited nearby between 1940–1969 (Cushing et al. 2023).
Density of fossil fuel infrastructure
km of natural gas pipelines per km² of land
Counties with the highest social-vulnerability scores average 7.5 km of gas pipeline per 100 km² of land, vs. 4.5 km in the lowest-vulnerability counties (Emanuel et al. 2021).
Metric
Measurement
Example
Community pollutant concentration and exposure
Reduction in absolute PM2.5 pollution burden (%), relative air pollution exposure between racial/ethnic groups, pollutant concentrations relative to federal guidelines, projected relative PM2.5 exposure across racial and income groups
Retiring 92 US coal plants (2015–2017) cut PM2.5 burden 11% for White subgroups vs. only 5% for non-White subgroups (Richmond-Bryant et al. 2020). African Americans have been exposed to 1.5x+ more industrial air pollution than White residents since at least the mid-1990s (Ard 2015). Without targeted policy, high-poverty and Black communities could see 26–34% higher PM2.5 exposure through the transition (Goforth & Nock 2022).
Occupational pollutant concentration
Pollutant concentration relative to occupational standards (%), pollutant concentration (g/m³)
Over 51% of silica air samples at hydraulic fracturing sites exceeded OSHA's exposure limit (Esswein et al. 2013); 15%+ of coal-mine dust samples exceeded the federal respirable-quartz limit (Doney et al. 2020).
Metric
Measurement
Example
Incidence and risk of disease
Relative cancer and subchronic disease risk by proximity, risk of disease associated with exposure (odds ratio)
Colorado residents within 1/2 mile of gas wells face 1.67x higher cancer risk (McKenzie et al. 2012); Taiwanese children in high-petrochemical-exposure areas had 1.75x leukemia risk (Weng et al. 2008); Colorado children near oil/gas wells were 4.3x more likely to have leukemia (McKenzie et al. 2017); a New Mexico community near a retired oilfield was 10x more likely to have rheumatic disease or lupus (Dahlgren et al. 2007).
Adverse birth outcomes
Change in preterm birth probability with increasing proximity to power plants (%), preterm birth rate associated with power plant retirement (%), change in fertility rates (births per 1000 women)
Each 5km increase in proximity to Florida power plants raised preterm-delivery probability 1.8–2.2% (Ha et al. 2015); California plant retirements cut preterm births from 7.0% to 5.1% within 5km (Casey et al. 2018).
Avoided premature mortality
Cumulative avoided premature mortalities (#), monthly mortality rate reduction (%), annual avoided premature mortalities (# per year), share of premature mortality by region (%), historical mortality rates by subpopulation (# per 100,000 people)
A 1 µg/m³ cut in PM2.5 is linked to a 1.7% lower monthly mortality rate for people over 65 (Fan & Wang 2020). 92% of power-plant-emission deaths (2010–2018) occurred in low-income or emerging economies (Tong et al. 2021). US 2018 coal-related mortality averaged 3.60/100k, with disparities by income, rurality, and race (Mayfield 2022).
Metric
Measurement
Example
Monetized health benefits or costs
Cumulative health benefits ($), annual health benefits ($ per year)
Retiring two Colorado coal plants is projected to yield $270M in health benefits from 2020–2035 (Martenies et al. 2019).
Metric
Measurement
Example
State transition-support legislation
Presence of just transition legislation by state; proportion of bills including various transition support resources
Nine US states have enacted 16 coal-transition bills total; 7 include worker training/education, 7 include infrastructure reinvestment, 1 addresses cultural impacts, and 3 help communities build capacity to access support (Wang et al. 2022).
Metric
Measurement
Example
Benefits and funding allocation
Proportion of program funding granted by region, project type, and career sectors (%)
Over 75% of POWER Initiative funding went to just five states (KY, WV, PA, OH, VA); 79% of coal counties nationally received no grants at all (Shelton et al. 2022).
Metric
Measurement
Example
Community consultation and collaboration
Proportion of transition bills requiring community involvement in decision-making
8 of the 16 state coal-transition bills include a stakeholder advisory group, but only 2 mandate public meetings on coal recovery (Wang et al. 2022).
Metric
Measurement
Example
Number of jobs
Cumulative jobs (#), job-years (#), sectoral share of total employment by county (%)
Global fossil fuel jobs are projected to fall from 12.6M today to ~3.1M by 2050 under a well-below-2°C pathway (Pai et al. 2021). Retiring two coal plants in Adams County, OH cost 1,100+ jobs (Jolley et al. 2019). Appalachian shale gas supported ~469,000 direct/induced job-years, 2004–2016 (Mayfield et al. 2019).
Distribution of jobs
Proportion of coal mining regions suitable for RE development (%), sectoral share of total employment by county (%)
Only 29% of China's coal-mining areas are suitable for solar, 5% for wind, vs. 62% and 7% respectively in the US (Pai et al. 2020). Appalachian shale-gas employment ranged from under 1% to over 60% of a county's total jobs (Mayfield et al. 2019).
Compensation
Median hourly wage ($/hr)
Natural gas and coal workers earn a median $30.33/$28.69 per hour vs. $25.95/$24.48 for wind and solar workers (NASEO, EFI & BW Research 2021).
Union membership
Proportion of workers represented by a union by sector (%)
Gas, oil, and coal electricity generation have 16–17% union representation vs. 10–11% for solar and wind; extraction/mining/processing ranges 7–12% (Herschell et al. 2022).
Metric
Measurement
Example
Government revenue
Annual government revenue ($ per year), change in revenue (%), cumulative lost tax revenue ($), annual lost tax revenue ($ per year)
Fossil fuels generated $138B in US government revenue 2015–2020, projected to fall 16–80% by 2050 depending on the transition pace (Raimi et al. 2022). Adams County, OH's coal closures cost $8.5M in local tax revenue (Jolley et al. 2019); California's oil-sector decarbonization could cost some counties up to $27M/year (Deschenes et al. 2021).
Transition 4 of 4
Building Decarbonization
Residential building decarbonization is critical to achieving a low-carbon future, but there are concerns regarding the distribution of benefits and burdens. Replacing gas appliances with electric alternatives has the potential to meaningfully improve indoor air quality and reduce asthma rates, especially for the low-income and Black children that have been documented to experience higher rates of asthma. However, energy-efficient technologies and programs remain less available, more expensive, and less used in low-income and renter-occupied housing. Increasing utility costs can also increase existing disparities in energy security.
Residential building decarbonization through the equity framework
Click to explore this transition's equity dimensions, indicators, and metrics.
Metric
Measurement
Example
Household fuel usage
Total households using natural gas for cooking (#), proportion of households using natural gas cooking (%), total households using solid fuels for cooking (#)
~47M US households (38%) use natural gas for cooking (EIA 2022); ~2.6B people worldwide rely on solid fuels for cooking (IEA et al. 2021).
Metric
Measurement
Example
Household pollutant concentration and exposure
Percentage of households exposed (%), change in personal pollutant exposure (%)
~62% of occupants in homes with unvented gas cooking burners are exposed to NO2 above acute health standards (Logue et al. 2014). In a Guatemala trial, improved stoves cut kitchen CO by 90% and personal CO exposure by 52% for children and 61% for mothers (Smith et al. 2010).
Pollutant emissions
Pollutant emissions per unit of energy (g/J) or per unit of time (g/hr)
Gas stovetops emit ~21.7 ng NOx per joule of use, and can exceed the 1-hour national air-quality standard within minutes without ventilation (Lebel et al. 2022).
Metric
Measurement
Example
Incidence and risk of disease
Proportion of asthma cases attributable to gas stove use (%), increased asthma risk associated with gas cooking (%), disability-adjusted life years (DALYs)
12.3% of Australian childhood asthma cases are attributable to gas stove use, equal to 2,756 DALYs (Knibbs et al. 2018); a meta-analysis found a 32% higher asthma risk with gas cooking (Lin et al. 2013). Globally, household air pollution from solid fuels causes an estimated 2.3M deaths and 91M DALYs per year (Murray et al. 2020).
California's gas-to-electric appliance transition could avoid ~354 deaths/year (Zhu et al. 2020); broader US efficiency improvements could avoid 1,800–3,600 deaths/year by 2050 (Gillingham et al. 2021).
Avoided morbidity
Annual avoided bronchitis cases (# per year)
California's gas-to-electric transition is estimated to prevent ~900 bronchitis cases annually (Zhu et al. 2020).
Metric
Measurement
Example
Monetized health benefits or costs
Cumulative health benefits ($), annual health benefits ($ per year)
California's gas-to-electric transition is projected to yield ~$3.5B/year in monetized health benefits (Zhu et al. 2020).
Metric
Measurement
Example
Energy efficiency measure availability
Proportion of stores selling energy efficient light bulbs by neighborhood poverty level (%); relative likelihood of landlord installing an efficiency measure in rental vs. owner-occupied properties (%); difference in number of efficiency measures by building type and homeownership status (#)
LED bulbs were stocked in 91% of stores in Wayne County, MI's lowest-poverty neighborhoods vs. 57% in the highest-poverty neighborhoods (Reames et al. 2018). Landlords are ~10% less likely to weatherize rental units (Melvin 2018); low-income multifamily units average 4.7 fewer efficiency features, worth $200–400/year in lost savings (Pivo 2014).
Metric
Measurement
Example
Energy efficiency measure cost
Relative cost of energy efficiency measures across communities ($), cost difference of efficiency upgrades across communities
In Wayne County, MI's highest-poverty neighborhoods, LED bulbs averaged $7.87 vs. $5.20 in the lowest-poverty neighborhoods, and the efficient/inefficient bulb price gap was nearly double ($6.24 vs. $3.10) (Reames et al. 2018).
Metric
Measurement
Example
Energy efficiency measure adoption
Relative energy efficiency measure adoption by homeownership status (%)
Renters are less likely than homeowners to report efficient refrigerators (−6.7%), dishwashers (−9.5%), and lighting (−4.9%) (Davis 2012).
Metric
Measurement
Example
Energy efficiency (EE) program participation
Participation rates in EE programs by income (%), relative likelihood of EE program participation
1.6% of low-income households received tax credits for efficient appliances vs. 11.8% of high-income households (Xu & Chen 2019); heads of household with a bachelor's degree were 8 points more likely to receive EE assistance (Pigman et al. 2021).
Metric
Measurement
Example
Number of jobs
Job-years (#), full-time equivalent jobs (#)
Decarbonizing Los Angeles's existing building stock could create 261,000–389,000 job-years; a decade of affordable-housing decarbonization alone could support 4,600–7,400 FTE union construction jobs/year (Jones 2021).
Metric
Measurement
Example
Energy insecurity
Share of households reporting energy insecurity pre- and post-energy efficiency program (%), relative risk ratio of experiencing energy insecurity by race and immigration status, difference between highest and lowest median household inflection temperatures across income groups (°F or °C)
75% of Weatherization Assistance Program recipients reported trouble paying utility bills before assistance vs. 49% after (Tonn et al. 2014). Native-born Black families with children face 2.11x the risk of energy insecurity of native-born White families (Hernández et al. 2016). Arizona's estimated "energy equity gap" between income groups is 4.7–7.5°F (Cong et al. 2022).
Energy consumption
Changes in electricity consumption across income and racial groups (%)
COVID-era measures raised AZ/IL residential electricity use 4–5% overall; low-income non-White AZ households saw a 9.69% increase vs. 3.69% for low-income White households (Lou et al. 2021).
Energy expenditures
Annual energy cost changes ($ per year), annual household energy savings ($ per year)
A 90% reduction in gas customers by 2050 could mean a ~$1,600/year bill increase for remaining customers (Davis & Hausman 2022); new-construction electrification mandates could cost $300–1,000+/year depending on climate (Davis 2021); targeted efficiency upgrades for households under 200% FPL could save ~$670/year on average (Wilson et al. 2019).
Utility disconnections
Increase in utility disconnections (%), utility disconnection rates across zip codes by race and ethnicity (%)
California disconnections rose 64% (2010–2016) and Texas's tripled (2006–2016) (Verclas & Hsieh 2018). SoCal Edison's highest-shutoff zip codes are disproportionately Latino (63% of shutoffs vs. 45% of the service territory) and Black (18% of shutoffs vs. 6% of the territory) (Sandoval & Toney 2018).
Metric
Measurement
Example
Displacement ("low-carbon gentrification")
Difference in average rent increase by renovation type (%), share of households facing rent increases due to efficiency renovations (%), proportion of tenants displaced from rent increases due to efficiency renovations (%)
Swedish multifamily retrofits with large efficiency gains were linked to 3–6 point higher rent increases (von Platten et al. 2022). German retrofits cut energy use 70% but left 50%+ of households facing higher costs (Weber & Wolff 2018). Swedish renovations were linked to a 25% tenant move-out rate vs. 14% in non-renovated buildings (Baeten et al. 2017).
Limitations and challenges related to energy equity metrics
This framework serves as a starting point for evaluating justice and equity impacts of energy transitions. To comprehensively evaluate energy justice and equity, qualitative data and personal experiences should be equally prioritized in the energy transition planning process, and researchers and transition planners should actively work to center historically marginalized communities in all stages of decision-making processes from research development through policy implementation and beyond. Further work is needed to address the limitations of existing metrics, and additional evaluation methods will be critical to effect energy transitions that are truly equitable.
01
Design and application of metrics is context dependent
Metrics vary significantly across transitions, disciplines, and scales. Metrics need to be adapted to be relevant to their geographies and local context.
02
Metric selection carries inherent subjectivity
The choice of energy equity metrics and their application are ultimately driven by researchers and decision-makers, which leads to the possibility of bias, whether intentional or unintentional.
03
Data availability limits what can be measured
Comprehensive, comparable data isn't always available. Comprehensive, large-scale datasets could highlight important patterns and trends that reveal hidden inequities in energy security and should be developed by adapting best practices and metrics from existing case studies.
04
Procedural justice is under-measured
Because our framework and metrics are based on previous studies, they are largely limited to distributional and recognition justice issues. Expanding the framework and adding new metrics to also evaluate inequities along other dimensions of justice is critical.
05
Energy justice is multi-dimensional
Equity outcomes are highly interconnected, and the same transition can deliver benefits under one equity dimension while causing losses under another. While balancing between the benefits and losses for all communities will inevitably prove challenging for policymakers and stakeholders, recognizing the trade-offs across different equity dimensions and indicators can help empower communities to find pathways that address their priorities.
06
Some harms can't be adequately quantified
Equity metrics and quantitative evaluation cannot always capture the complexity of energy justice and equity. Decision-makers can collaborate with stakeholders from affected communities to inform the design of quantitative models or metrics, and qualitative data and personal experiences should be equally prioritized in the energy transition planning process.
Methodology summary
This framework draws on a literature review spanning public health, economics, sociology, and public policy, searched through Google Scholar and PubMed Central for research published between 2000 and 2023 (final search: October 2023). In total, researchers assessed more than 400 articles and reports, drew usable equity metrics from 132 of those sources, and referenced an additional 67 articles for background and context. The resulting analytical framework is structured after the Vulnerability Scoping Diagram (Polsky et al. 2007), originally developed to assess vulnerability to environmental hazards, and organizes the compiled metrics into the three equity dimensions used throughout this page: health, access, and livelihood.
1
Literature review
Thematic searches on Google Scholar (general queries) and PubMed Central (health-related queries), plus a snowball citation approach to surface additional relevant work from references.
2
Screening and inclusion
Articles were included if they identified a clear assessment method and a quantitative metric relevant to equity, were accessible through University of California institutional access, and were written in English.
3
Framework development
Metrics from the included studies were categorized into equity dimensions, indicators, and metrics, producing the analytical framework used throughout this page.
An equitable transition requires measurement.
The full paper compiles dozens of metrics across health, access, and livelihood for renewable energy, fossil fuel phaseout, transportation electrification, and building decarbonization: a starting point for researchers, planners, and communities alike.
Citations throughout the metric tables above (e.g. "Wu et al. 2023") reference studies compiled in the original paper. See the paper for the full reference list. A selection of frequently cited sources is listed below.
Sunter, D.A., Castellanos, S., & Kammen, D.M. (2019). Disparities in rooftop photovoltaics deployment in the United States by race and ethnicity. Nature Sustainability.
Millstein, D., Wiser, R., Bolinger, M., & Barbose, G. (2017). The climate and air-quality benefits of wind and solar power in the US. Nature Energy.
Borenstein, S., & Davis, L.W. (2016). The distributional effects of US clean energy tax credits. Tax Policy and the Economy.
Cushing, L. et al. (2023). Historical red-lining is associated with fossil fuel power plant siting. Nature Climate Change / related equity studies.
Czolowski, E.D. et al. (2017). Toward consistent methodology to quantify populations in proximity to oil and gas development. Environmental Health Perspectives.
Pai, S. et al. (2021). Meeting well-below 2°C target would increase energy sector jobs globally. One Earth.
Bauer, G., Hsu, C-W., & Lutsey, N. (2021). When might lower-income drivers benefit from electric vehicles? ICCT.
Guo, S., & Kontou, E. (2021). Disparities and equity issues in electric vehicles rebate allocation. Energy Policy.
American Lung Association (2022). Zeroing in on Healthy Air.
Knibbs, L.D. et al. (2018). The Australian Child Health and Air Pollution Study. Environment International.
Xu, X., & Chen, C. (2019). Energy efficiency and energy justice for US low-income households. Energy Policy.
The 2035 Initiative · UC Santa Barbara
Equity Metrics for Low-Carbon Energy Transitions · July 2026
By Sage Kime, Veronica Jacome, David Pellow, and Ranjit Deshmukh. This page summarizes the report and is not a substitute for it.